Do Claude Code hooks actually cost you tokens?
9 min read
On this page
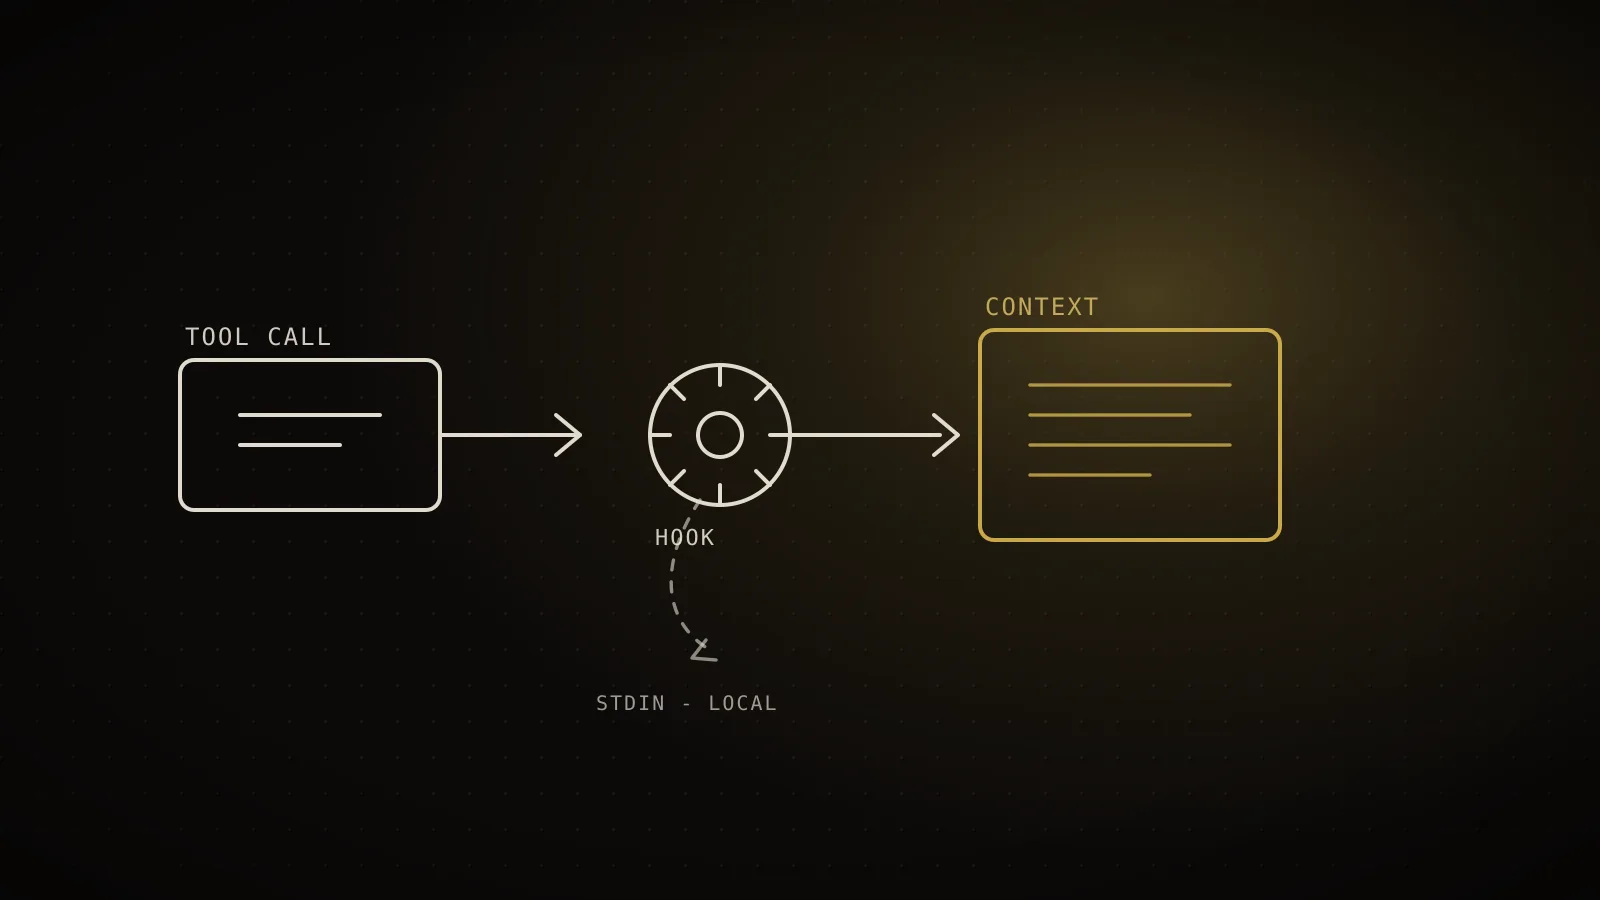
Most of what a hook touches never reaches Claude at all. The stdin payload Claude Code hands your script - session_id, tool_input, cwd - is process I/O the model never sees a second time, since it already has that information from making the tool call itself. The tokens only show up when your hook's own output writes into one of a handful of specific fields, and whether that fires once a session or on every matched tool call is what decides whether the number is trivial or real.
additionalContext, systemMessage, a permissionDecisionReason on a blocked call, or updatedToolOutput. Estimated on realistic payloads built from the documented schema (this site's own sourced token formula, not a live pull): a one-time SessionStart context block runs ~66 tokens; a PreToolUse deny reason firing on 50 matched calls in one session adds ~1,900. The pattern actually worth auditing is a hook that echoes raw command output back unfiltered - that alone can add thousands of tokens a session for nothing.What a hook actually receives, and what comes back
A hook is a script or HTTP endpoint Claude Code calls at a defined point in the agentic loop - before a tool runs, after it finishes, when a session starts, when Claude stops responding, and about twenty other events, from PreCompact to SubagentStop to a plain Notification. Some fire once per session (SessionStart, SessionEnd), some once per turn (UserPromptSubmit, Stop), and some on every single tool call the agentic loop makes (PreToolUse, PostToolUse). That last category is the one worth watching, because "cheap per call" and "fires fifty times in a session" are not the same sentence.
session_idcwdtool_nametool_inputtool_use_idtranscript_pathProcess I/O between Claude Code and your script. None of it is re-sent to the model - Claude already has tool_input from making the call itself.
additionalContextsystemMessagepermissionDecisionReasonupdatedToolOutputstderr (exit code 2 only)This text becomes part of what Claude reads on its next request. Everything this guide measures lives in one of these five fields.
Claude Code writes a JSON object to the hook's stdin (or POSTs it, for an HTTP hook) and waits for a response. What the script does in between - grep a log file, hit an API, check a policy - never touches the model. Only the script's own output can do that, and only through a small, named set of fields.
The stdin payload every hook gets, and why it's free
Per the current hooks reference (code.claude.com/docs/en/hooks, checked while building this guide), every hook receives the same base fields regardless of event - session_id, prompt_id, transcript_path, cwd, permission_mode, hook_event_name - plus event-specific ones. A PreToolUse hook watching Bash calls also gets tool_name, tool_input, and tool_use_id:
{
  "session_id": "abc123",
  "cwd": "/home/user/my-project",
  "hook_event_name": "PreToolUse",
  "tool_name": "Bash",
  "tool_input": { "command": "npm test", "timeout": 120000 },
  "tool_use_id": "toolu_01ABC123"
}
None of that is new information to Claude. It's the same tool_input Claude just generated to make the call in the first place - Claude Code is handing your script a copy so it can inspect or block the call, not re-teaching the model something it already wrote. Whether your PreToolUse hook is five lines or five hundred, whether it reads three fields or twenty, that reading costs zero tokens. The cost only starts on the way back out.
Cheap hooks vs expensive hooks, measured
Cadence is what actually compounds: a 38-token deny reason at 50 matched calls in one session adds up to ~1,900 tokens - almost 30x the one-time SessionStart cost. The unfiltered test-output pattern across 10 runs adds ~4,470 tokens; filtering to failures first (the official docs' own example) cuts that to ~275. All figures: estimated from realistic example payloads, this site's own token formula.
The numbers above come from real example payloads, built directly from the documented output schema, run through this site's own sourced token estimator (the same ~4 chars/token prose, ~3.2 chars/token code formula behind the CLAUDE.md Token Counter - full methodology cited there). They're estimates on realistic text, not a pull from a live transcript, so treat the exact figures as illustrative and re-check your own hooks with the audit below rather than assuming these numbers are yours.
What they show is cadence beats size. A verbose one-time SessionStart block (project status, open PRs, a known-issue note) landed at 66 tokens - noticeable, forgettable, gone after the first request thanks to prompt caching. A terse 38-token PreToolUse deny reason looks cheaper in isolation, but if the matcher catches Bash calls broadly and the session runs fifty of them, that's ~1,900 tokens from a string most people would never think to measure. Cadence is the variable page-1 pricing roundups never mention, because none of them are about hooks specifically - they're about plan pricing.
Where the tokens really come from
Five fields carry everything a hook can hand back to the model: additionalContext and systemMessage (either event can attach these), permissionDecisionReason (shown to Claude when a PreToolUse hook denies a call), updatedToolOutput (replaces what a PostToolUse hook lets Claude see), and stderr when a hook exits with code 2, which Claude Code feeds to Claude as a blocking error. Every other field in a hook's JSON output - continue, suppressOutput, terminalSequence, the various permissionDecision values - controls Claude Code's behavior, not the model's context.
The failure mode is a hook that treats one of those five fields as a dumping ground instead of a filter. The official cost-reduction docs actually lead with the right pattern: a PreToolUse hook that intercepts a test command and rewrites it to show only failures, so "Claude reading a 10,000-line log file to find errors" becomes "a hook that greps for ERROR and returns only matching lines." Do the same measurement in reverse and the shape is obvious - a hook that dumps 40 lines of passing test output into additionalContext on every run costs about 447 tokens a call; the same hook filtered down to just the failure costs about 28. Over ten test runs in a session that's roughly 4,470 tokens versus 275, for scripts that do the exact same job everywhere except the last line. Anthropic's own tracker carries an open request (filed against the claude-code repo) asking to expose token and cost data directly in hook inputs - as of this guide, there's no built-in way to see this from inside a hook itself, which is exactly why nobody had measured it from the outside either.
A five-minute audit for your own hooks
The --debug step is the one worth doing at least once, because it's the only step that shows you real behavior instead of a script you're reading cold. Trigger the hook, then read the debug log's modified tool input keys line (or whichever field your hook writes) to confirm what actually left the process boundary - not what the script's comments claim it does.
When the overhead is worth paying
Compare this to what an MCP server does: every configured server adds its name and instructions to every session whether you call it or not - the cost is standing, and it's on by default the moment the server is registered. A hook is the opposite. It adds nothing until its own code chooses to write into one of those five fields, and even then only on the events and matchers you scoped it to. That makes the overhead entirely opt-in and entirely visible in the script itself - there's no hidden per-session tax to go looking for, just a specific string to go read.
Given that, the practical rule is short: a hook that only allows, denies, or silently rewrites input costs nothing worth auditing. A hook that injects a short, one-time context block at SessionStart or UserPromptSubmit costs a rounding error. The only pattern that earns a second look is a high-frequency hook - anything on PreToolUse or PostToolUse with a broad matcher - that writes back more than a short, filtered string. Most teams building hooks are already doing this correctly by accident, because the whole point of a PreToolUse filter is usually to shrink what Claude reads, not grow it. The audit above just confirms it, in five minutes, instead of assuming it.
When this doesn't apply
HTTP hooks receive the same fields as a POST body instead of stdin, so the field-level cost logic above holds, but this guide's own numbers were built and estimated for command hooks specifically - if you're running an HTTP hook server, verify its exact response payload against your own logs rather than reusing these figures. And a SubagentStart or SubagentStop hook fires inside a subagent's own isolated context window, not your main session's - a chatty hook there compounds against that subagent's budget, so audit subagent-scoped hooks separately rather than assuming one pass of the main transcript covers them.
FAQ
- Do hooks add tokens just by being configured, like MCP servers do? No. An MCP server's name and instructions load into every session whether it's called or not. A hook adds nothing until its own script chooses to write into
additionalContext,systemMessage, a deny reason, orupdatedToolOutput- and only on the events and matchers it's scoped to. - Does the hook's stdin input ever get sent to the model? No. It's process I/O between Claude Code and the hook script. Claude already has the same information (like
tool_input) from generating the call itself, so re-sending it would just be duplicate context, and Claude Code doesn't do that. - Which hook events are worth watching for token cost? Ones with a broad matcher on
PreToolUseorPostToolUse, since they fire on every matching tool call. ASessionStartorSessionEndhook fires once and its cost, however verbose, never compounds within the session. - How do I check what my own hooks are actually sending back? Run
/hooksto see what's registered, grep your scripts foradditionalContext,systemMessage,permissionDecisionReason, andupdatedToolOutput, then runclaude --debugand trigger the hook once to confirm what it wrote in the debug log. - Can a hook make a session use fewer tokens overall? Yes - that's the documented use case ahead of any cost concern. A
PreToolUsehook that filters a large command's output before Claude ever sees it (the official example: reducing test output to just failures) can cut far more from a session than any hook's own overhead adds.
Want the numbers above run against your own hooks.json instead of these worked examples? The hook token cost calculator parses your actual config, classifies each hook's cadence, and totals it up worst-first once you tell it what each one writes back.
None of this requires reading your own hook scripts by hand if you'd rather not - the free scan reads your real Claude Code session history and setup and tells you where the tokens are actually going before you go hunting for a stray additionalContext block. If MCP servers turn out to be the bigger source of standing overhead in your setup, the guide to finding and disabling unused ones is the more likely place to start, and the full list of context-reduction levers covers what usually moves the number more than hooks do either way.
See your own numbers
These are aggregates from real sessions. Your setup is different - run the free scan and get the breakdown for your own Claude Code history. It runs locally; nothing about your code or prompts leaves your machine.
npx usagecutRun a free scan → Made by Neo
UsageCut by ClockedCode - not affiliated with Anthropic. The figures on this page are measured on real Claude Code sessions and labeled measured or estimated where it matters.