ccusage Alternatives: What Actually Replaces It (and What Doesn't)
8 min read
On this page
Type npx ccusage@latest into a terminal and it does exactly what the name promises: reads your local Claude Code logs and prints daily, weekly, and per-session spend, no account and no network call required. That part works well and costs nothing. What it was never built to do is explain why any of those numbers are that big, or fix the parts that are wasteful - that's a different job, and it matters which alternative does that job versus which one just repaints the same total.
What does ccusage actually do well?
ccusage is an open-source npm CLI (npx ccusage@latest, no install required) that parses the JSONL session logs Claude Code already writes to disk and turns them into reports: daily, weekly, monthly, per-session, and 5-hour billing-block breakdowns, plus a beta statusline mode for wiring the number into your prompt. As of its current release it also reads usage logs from over a dozen other coding-agent CLIs (Codex, Gemini CLI, OpenCode, Amp, and more), so ccusage daily --all gives one combined view across tools instead of just Claude Code. Everything runs locally against files already on your machine - no API key, no signup, and nothing to configure before the first report prints.
For "what did I spend, and when," ccusage answers correctly and for free. There's no case for replacing it with something heavier if that's the whole question.
What are the real alternatives, and how are they different?
Two other open-source projects come up in the same conversation, and they're solving genuinely different problems, not competing head-to-head with ccusage or each other:
- Claude Code Usage Monitor (PyPI package
claude-monitor, often shortened to "Claude Monitor," aliasescmonitor/ccmonitor) is a live terminal dashboard rather than a report generator. It watches your session in real time and adds things a point-in-time CLI report can't: burn-rate pace, forecasts for when you'll hit your reset, and - in its current version - a trust layer that labels every number asofficial(pulled from Claude Code's ownrate_limitsoutput),local_estimate, or lower confidence, plus an opt-in local history warehouse that survives past Claude's own 30-day log cleanup. - ccflare is not really in the same category at all. It's a multi-account proxy: it sits in front of your actual API traffic, load-balances across several Anthropic or OpenAI accounts, and ships a dashboard with request history and analytics as a side effect of that routing job. That's a meaningfully different architecture from the other two - ccusage and Claude Monitor only ever read log files after the fact, while ccflare intercepts and forwards live requests. Worth knowing before you install it for "just the usage numbers."
Facts checked against each project's own GitHub repository on 2026-07-26. ccflare is included because it is often mentioned alongside ccusage, but it is architecturally different - a proxy that sits in your request path, not a passive log reader.
ccusage vs Claude Monitor vs ccflare vs UsageCut, compared
| | ccusage | Claude Monitor | ccflare | UsageCut | | --- | --- | --- | --- | --- | | Core job | Print spend reports | Live burn-rate monitor | Multi-account proxy | Scan, diagnose, fix | | Where it runs | Local CLI | Local terminal | Self-hosted server | Local scan (CLI + web report) | | Needs your API key | No | No | Yes (it proxies requests) | No | | Multi-agent support | Yes, 15+ CLIs | Claude Code only | Anthropic + OpenAI routing | Claude Code only | | Shows why tokens went up | No | No | No | Yes - dead MCP servers, oversized CLAUDE.md, duplicate reads, un-offloaded exploration | | Applies a fix | No | No | No | Yes, previewed and reversible | | Cost | Free | Free | Free (self-hosted) | Free |
The pattern in that table is the point: three different, well-built answers to "what's my number," and one answer to "what's in it and what do I do about it." They're not substitutes for each other.
Where does every one of these fall short?
A raw total, even a beautifully live one with forecasting, is still one number. It can't tell you whether the spend is legitimate work or six MCP servers you never call loading their tool schemas into every session anyway. That's the actual gap UsageCut is built to close - not a better dashboard, a different question.
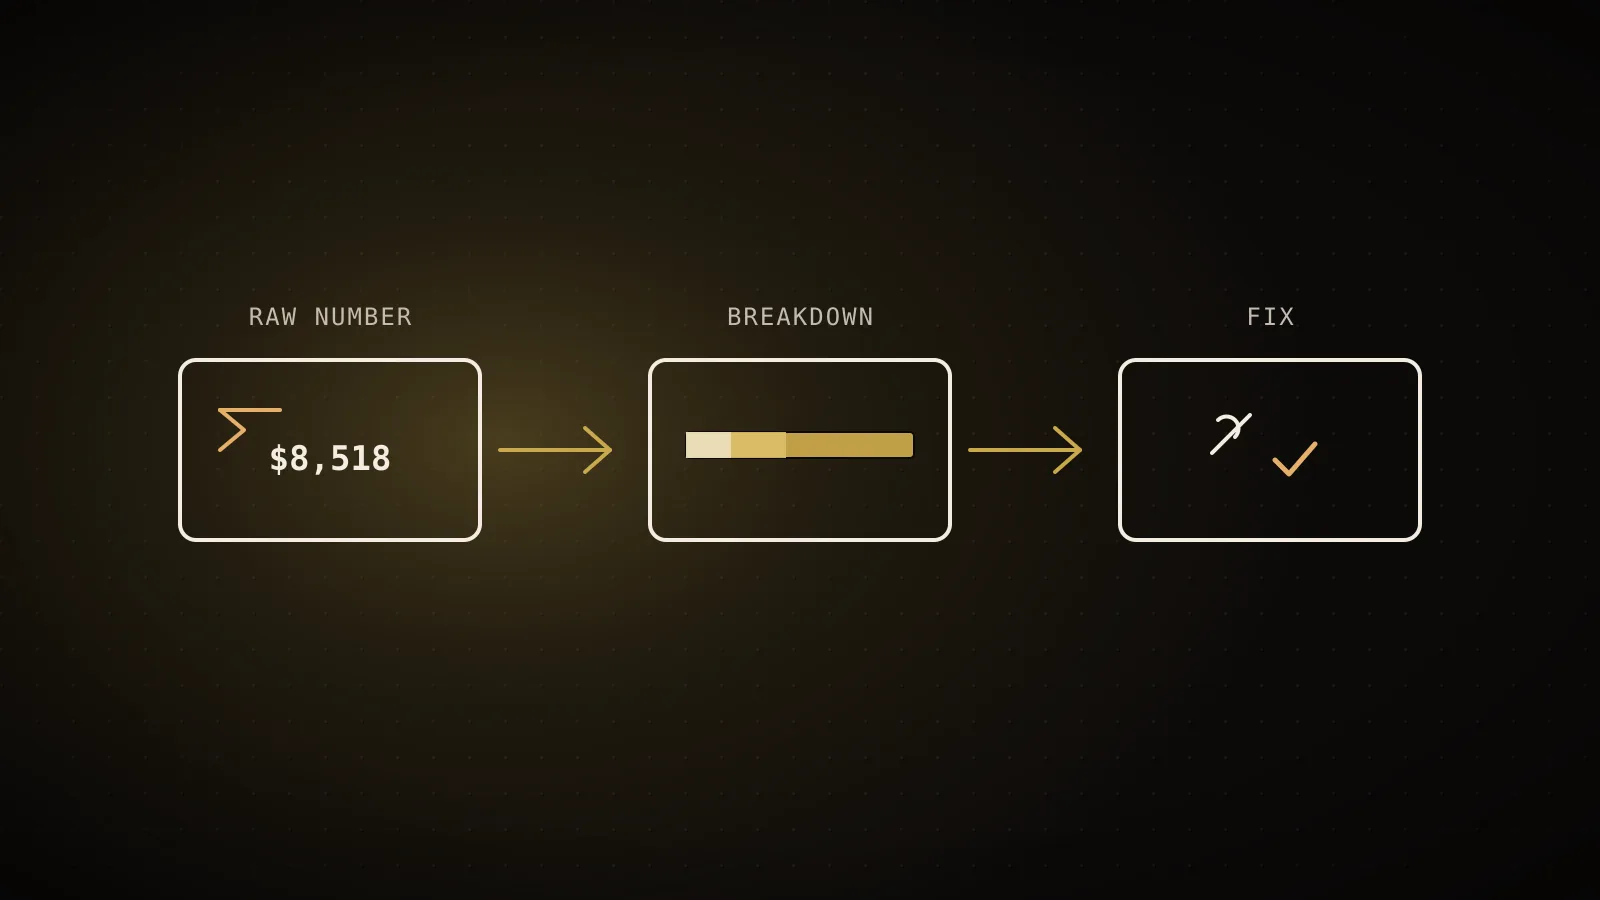
Here's what that looks like on a real measured history from this project's own transcripts, not a hypothetical:
What a tracker shows (1,037 sessions, deduped)
~$8,518 total
MEASURED - one true number, no cause attached
The same dollars, split by what caused them (MEASURED)
What actually closes it (ESTIMATED, modeled on the same history)
Source: docs/usagecut-real-savings-measurement.md, this project's own measured Claude Code history. The dollar total and its cache-read/write/output/input split are measured from billed usage; the two levers at the bottom are modeled estimates, not guarantees for any other account.
A tracker would correctly report the ~$8,518 total across those 1,037 sessions and stop there. Categorized by cause, cache-read (the bill for re-sending everything already in context, every single turn) is 44% of that cost, cache-write is 37.8%, output is 15.9%, and the prompt you typed is 2.3% - a rounding error next to what's already sitting in context. That split is what tells you where to spend effort: offloading heavy exploration to a subagent and slimming an oversized CLAUDE.md are the two levers that move it, and a tracker has no way to show either one because it only ever sees the total, not the cause.
Being direct about the other side: UsageCut doesn't run continuously in your terminal, doesn't forecast when you'll hit a reset, and doesn't do multi-agent or multi-account routing. It's a scan you run when you want to know what's driving your usage, plus a way to fix what it finds. If what you want is a live number on your statusline, that's still ccusage's job, not UsageCut's.
When is ccusage (or another tracker) still the right pick?
Keep ccusage - or add Claude Monitor on top of it - if any of this is true: you already know your setup is lean and just want a live number, you work across several coding-agent CLIs and want one combined report, or you want forecasting and reset-time warnings while you work. None of that needs replacing, and installing a diagnosis tool on top of a setup that isn't wasteful just adds a step for no benefit.
Reach for a diagnosis-and-fix tool instead when the number itself isn't the question anymore - when you already know it's high and want to know which specific thing is causing it, or when you'd rather have dead MCP servers disabled and an oversized CLAUDE.md trimmed than keep staring at a total that doesn't change on its own. If a session's cost looks flat-out abnormal rather than just high, check the cache token bug first - a metering bug and ordinary setup waste produce different signatures, and no tracker or fixer tells them apart for you automatically.
FAQ
- Is ccusage free and safe to use? Yes. It's an open-source CLI that reads Claude Code's local JSONL session logs and never sends them anywhere - no account, no API key, no network call for the reports themselves.
- What's the actual difference between ccusage and Claude Monitor? ccusage generates point-in-time reports (daily, weekly, session, JSON output) from local logs. Claude Monitor is a live terminal dashboard that watches a session in progress and adds burn-rate forecasting, reset-time warnings, and provenance labels on top of the same underlying data.
- Does ccflare do the same thing as ccusage? No. ccflare is a proxy that routes your actual API requests across multiple accounts and shows analytics as part of that job. ccusage and Claude Monitor only read log files after the fact; they never sit in your request path.
- Does UsageCut replace ccusage? Not as a live statusline, no - if that's all you want, keep ccusage. UsageCut answers a different question: which specific things (dead MCP servers, an oversized CLAUDE.md, duplicate reads, un-offloaded exploration) are driving your number, and it applies the fix once it finds them.
- Which one should I install? If you just want a number, ccusage. If you want that number live with forecasting, add Claude Monitor. If you want to know why the number is what it is and have something fix it, that's the scan UsageCut runs - they solve different parts of the same problem and can coexist.
- Do any of these tools upload my code or prompts? ccusage, Claude Monitor, and UsageCut all read only local log files and never upload code or conversation content - the aggregate numbers are the only thing that can leave the machine, and only for UsageCut's web report. ccflare is the exception in kind, not in trust: it's self-hosted, but by design it proxies your live API traffic rather than reading logs after the fact.
None of this is a case against trackers - ccusage and Claude Monitor are both good at the job they set out to do. It's a case for knowing which job you need done before you install something. If you already know your number is high and want the categorized reason instead of a running total, run the free scan - it reads the same local logs these tools do and shows the breakdown instead of the total, or size your CLAUDE.md specifically with the token counter if that's the piece you suspect. And if a plan upgrade is what brought you here, what the Max plan buys you is worth reading before either the tracker or the upgrade.
See your own numbers
These are aggregates from real sessions. Your setup is different - run the free scan and get the breakdown for your own Claude Code history. It runs locally; nothing about your code or prompts leaves your machine.
npx usagecutRun a free scan → Made by Neo
UsageCut by ClockedCode - not affiliated with Anthropic. The figures on this page are measured on real Claude Code sessions and labeled measured or estimated where it matters.