Why Claude Code suddenly burns 10-20x more tokens
7 min read
On this page
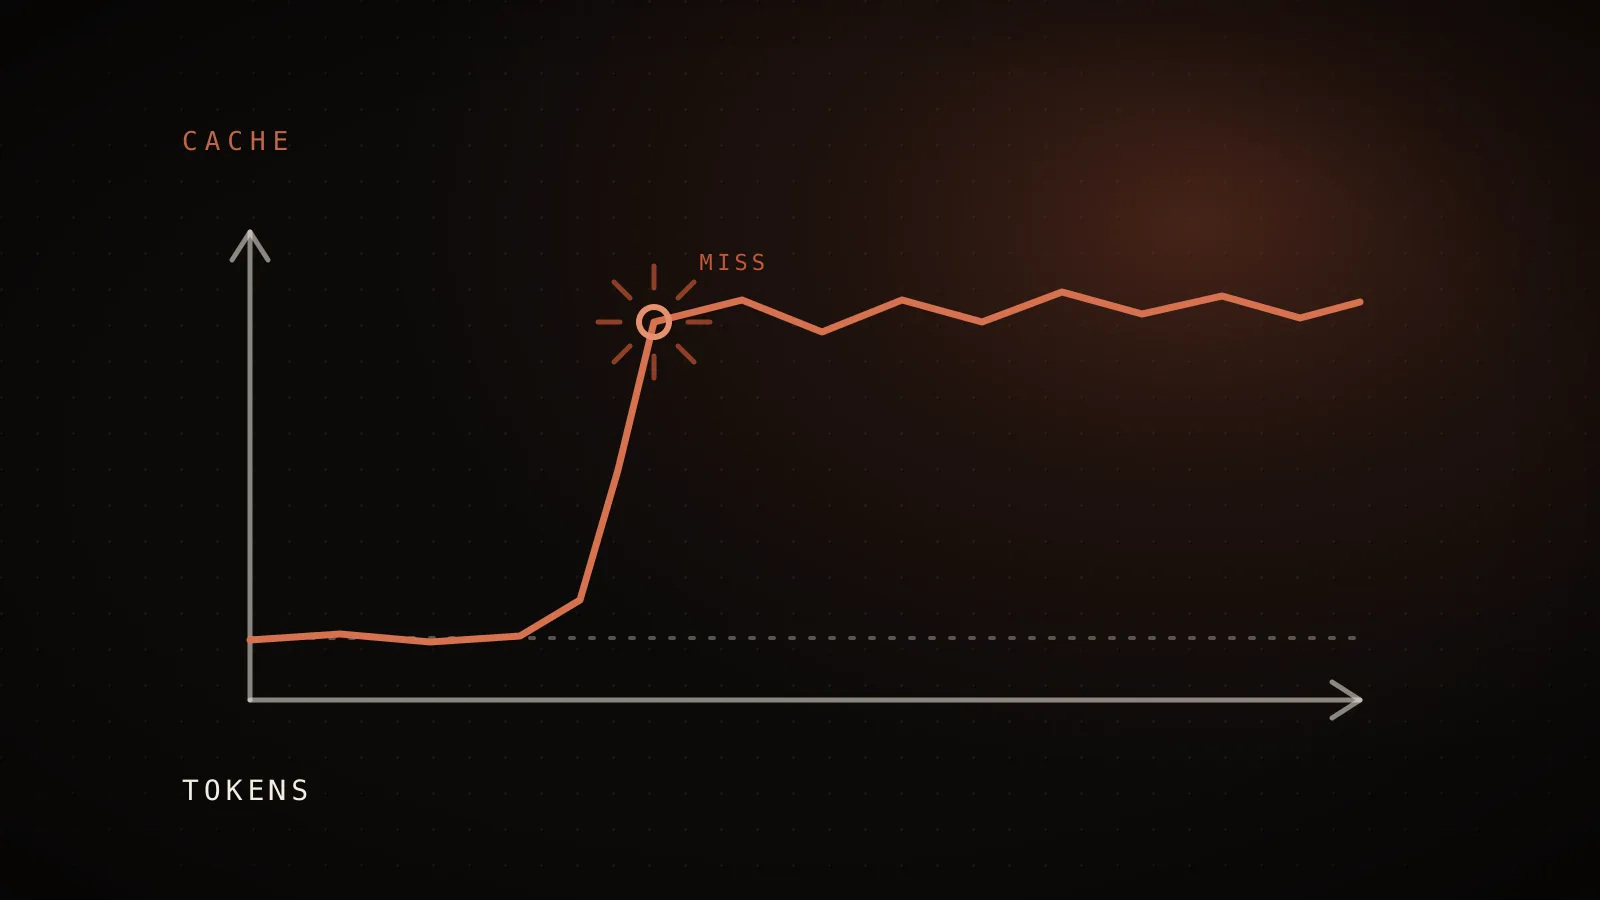
One session costs 20 cents. The next one, doing the exact same kind of work, costs three dollars. Nothing about your prompts changed - what changed is whether Claude Code's prompt cache actually held. When it fails to, every turn reprocesses the whole conversation from scratch instead of reading most of it back cheaply, and that gap alone accounts for the 10-20x cost jumps documented in three separate Claude Code bug reports this year.
--resume regression (#34629) fixed on 2026-04-01; the other two were closed as stale or duplicate, not confirmed fixed. Current version is 2.1.217. Run /usage and check whether cache_create drops after your first message - if it stays high every turn and none of the documented cache-reset triggers apply, you likely have the bug; if it drops but your bill is still high, that's setup waste, a different problem with a different fix.What's actually breaking
Claude Code has no memory between API calls. Each request carries the system prompt, your project's CLAUDE.md, and the full conversation built up so far, with whatever's new appended at the end. According to Anthropic's own prompt-caching documentation, the API matches that request against a cached prefix - exactly, in order: system prompt first, then project context, then the conversation. When the match holds, only the new exchange gets processed. When something breaks the match, the whole prefix gets rebuilt and billed as fresh input, every single turn, not just once.
That failure mode is exactly what a developer captured in issue #34629: on a working version, cache_create collapses from 22,946 tokens on the first message to under 900 tokens by the fourth. On the regressed version, cache_create sits above 54,000 tokens on every single turn, because the conversation history never lands in cache at all.
v2.1.68 - cache working
v2.1.76 - cache broken
On the working version, cache_read grows and cache_create drops toward zero after the first message - the prefix is being reused. On the broken version, cache_read stays flat at the system-prompt floor and cache_create repeats the entire conversation on every turn, so cost per message never drops.
The reports behind the 10-20x number
Three independent bug reports describe the same underlying failure from different angles:
- #34629 -
claude --print --resumesessions stopped reusing the cache prefix starting around v2.1.69. Reported as a roughly 20x cost increase per message versus v2.1.68. - #44869 - a fresh session with no special configuration burned 16,000-26,000 tokens on a single "hello," which only makes sense if the cache was never engaged at all.
- #48896 - roughly 2,000 tokens per simple query even with a project CLAUDE.md that should have been cached after the first message.
Page 1 for this topic right now is a Reddit PSA thread, two thin recap posts, and the three raw issues above with no one having pulled the actual fix status together - which is the gap this section closes.
Which version fixed what
Not all three are in the same state. I checked the GitHub API directly rather than trusting the issue title:
#34629 --print --resume stopped reusing the cache prefix
Closed 2026-04-01 - completed · Anthropic marked this fixed.
#44869 Prompt cache not utilized, 16-26K tokens on a plain "hello"
Closed 2026-05-23 - not_planned · Closed by the stale-issue bot after 30 days idle - not a confirmed fix.
#48896 ~2,000 tokens per simple query with caching enabled
Closed 2026-05-30 - not_planned · Closed as a duplicate report - not a confirmed fix.
Cache-related fixes since, per the official changelog
v2.1.181 - Fixed prompt caching not reading on custom ANTHROPIC_BASE_URL and Foundry (unstable per-request attestation token).
v2.1.200 - Mid-conversation system block now caches correctly behind LLM gateways and custom base URLs.
v2.1.216 - Fixed quadratic message-normalization cost in long sessions that stalled resumes.
#34629 carries state_reason: completed - Anthropic's own classification of "we fixed this." The other two carry not_planned, which GitHub uses for stale-bot closures and duplicate triage alike - neither is Anthropic confirming the underlying behavior is gone. Running claude --version in this repo right now returns:
$ npx @anthropic-ai/claude-code --version
2.1.217 (Claude Code)
That's three cache-related fixes past the last of the three closures, per the official changelog. If you're on an older 2.1.x build, updating is the first thing to try before assuming you've found a new instance of the bug.
Bug, or just normal cache invalidation?
Before you conclude you've hit a live bug, rule out the documented cases first. Anthropic's prompt-caching page lists a specific, closed set of actions that invalidate the cache by design - a model or effort-level switch, toggling fast mode, an MCP server connecting or disconnecting mid-session, a new tool-deny rule, compaction, or a version upgrade. Any one of those explains a single expensive turn. What it does not explain is cache_create staying high on every turn of an otherwise idle session.
Run /usage. Does cache_create stay high on every turn, not just the first one?
If it drops after turn 1, caching is working - your cost is coming from what you keep in context, not a bug.
If it stays high: did you switch models or effort level, toggle fast mode, connect/disconnect an MCP server, add a tool deny rule, compact, or upgrade mid-session?
Any of those resets the cache by design (Anthropic's own prompt-caching docs list these as the only actions that invalidate it) - one expensive turn after each is expected, not a bug.
None of those happened, and cache_create still repeats every turn on a stock session?
That matches the pattern in issues #44869 and #48896. File a fresh issue with your /usage output and Claude Code version - don't install a third-party "fix".
Cache is behaving normally, but the dollar total is still high?
That's setup waste, not a bug - an oversized CLAUDE.md, dead MCP servers, or duplicate reads padding what gets cached and re-read every turn.
| Signal | Cache bug | Setup waste |
| --- | --- | --- |
| cache_create in /usage | High on every turn, not just after a reset trigger | Normal shape - low after turn one |
| Dollar cost | Spikes suddenly, same workflow as before | Creeps up gradually as context accumulates |
| Fix | Update Claude Code, file a fresh issue if it persists | Trim CLAUDE.md, drop dead MCP servers, offload exploration |
| Where to read more | This page | Claude Code token usage too high? |
Also worth knowing before you panic: subagents always use the five-minute cache TTL, even inside a subscription session that gets the one-hour TTL - that's documented behavior, not a leak. A workflow that spawns a lot of subagents will show more cache_create than a single-thread session doing the same work, on purpose.
/usage. And /usage session totals reset on /clear, so compare cache_create across turns inside one uncleared session, not across sessions. On Bedrock, Google Cloud's Agent Platform, or Microsoft Foundry, caching support and the one-hour TTL vary by model and region, so a flat cache_create there may just mean the model or region you picked doesn't support it yet.Don't install a random "cache fix" tool
Both #44869 and #48896 have comments from the same account pushing a third-party npm package that claims to intercept and "fix" Claude Code's cache behavior. I'm not linking it. An unaudited package that sits between your terminal and Anthropic's API, on the strength of an anonymous GitHub comment, is a worse trade than a slow session - you have no idea what else it reads or sends. The verification path in this guide (check /usage, rule out the documented triggers, update, then file an issue with real numbers) doesn't require installing anything you didn't already have.
FAQ
- Is the Claude Code cache bug fixed? Partially, as of this writing. Anthropic marked the
--resumeprefix regression (issue #34629) fixed on 2026-04-01. The broader "cache never engages" reports (#44869, #48896) were closed as stale or duplicate, not confirmed fixed, and the changelog shows cache-related fixes as recently as v2.1.216. Update to the latest version before assuming you've hit a new bug. - How do I know if I'm hitting the cache bug right now? Run
/usageand watchcache_createacross a few turns in the same session. It should drop sharply after the first message. If it stays high on every turn and you haven't switched models, changed effort level, toggled fast mode, connected or disconnected an MCP server, or upgraded mid-session, that matches the bug pattern rather than a documented cache reset. - Why does my token cost jump 10-20x with no code changes? Almost always because
cache_create(billed at the full write rate) is happening on every turn instead of just the first one. Either a cache-invalidating action triggered it that turn, or the cache isn't holding at all, which is the bug this guide covers. - Does upgrading Claude Code fix cache problems? It can - three of the last several dozen releases (v2.1.181, v2.1.200, v2.1.216) specifically targeted cache or resume-related regressions. If you're behind, that's a free first step before filing a new report.
- Is a third-party tool that claims to fix Claude Code's caching safe to install? Treat any such tool with real skepticism. It would sit between your terminal and Anthropic's API with no audit trail beyond a GitHub comment. Verifying and reporting the bug through official channels doesn't require installing anything new.
The pattern is the same whether the cache is healthy or broken: everything sitting in context gets billed on every turn it stays there. Cache and compaction, explained covers the healthy-cache mechanics in full, and how to reduce context window usage covers what to trim regardless of which problem you have - or run UsageCut's free local scan to see which of those is actually driving your own bill.
See your own numbers
These are aggregates from real sessions. Your setup is different - run the free scan and get the breakdown for your own Claude Code history. It runs locally; nothing about your code or prompts leaves your machine.
npx usagecutRun a free scan → Made by Neo
UsageCut by ClockedCode - not affiliated with Anthropic. The figures on this page are measured on real Claude Code sessions and labeled measured or estimated where it matters.