How to add a live context window progress bar to Claude Code's status line
9 min read
On this page
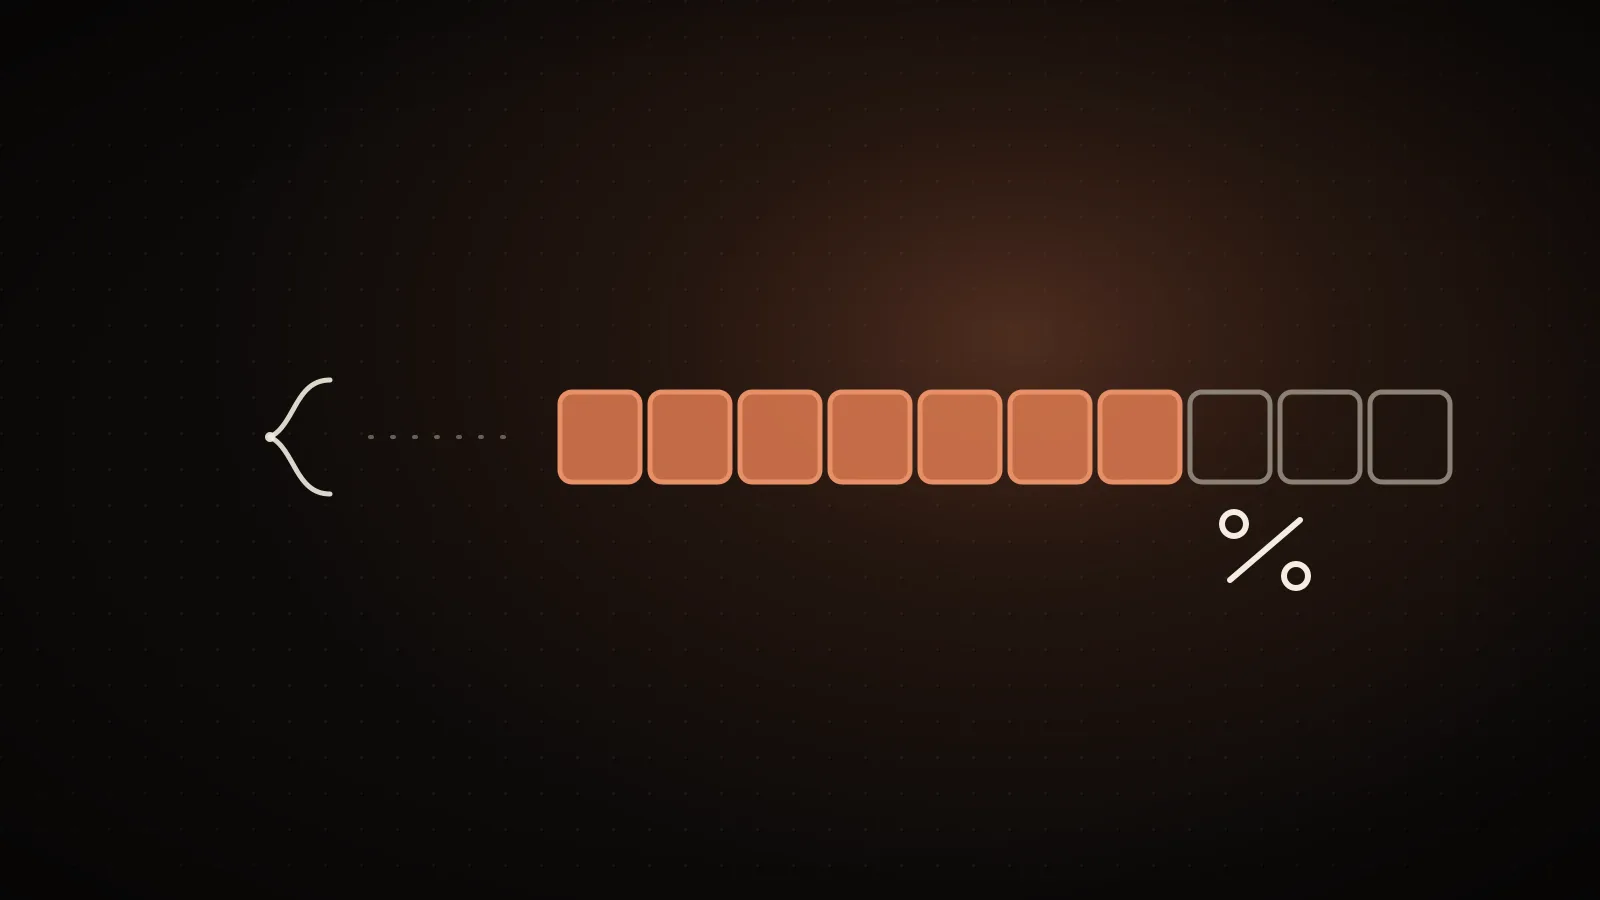
Run /statusline show model name and context percentage with a progress bar and Claude Code writes the script for you. Everything that bar needs is already in the JSON Claude Code pipes to your terminal on every turn: a pre-calculated used_percentage, the raw cache-token counts behind it, and the model's real context window size. The manual version below is the same mechanism built by hand and tested against that real payload, so you can see exactly what changes at 8%, 76%, and 93% before you trust it in your own setup.
/statusline show model name and context percentage with a progress bar is the fast path. To build it yourself, add a statusLine command to ~/.claude/settings.json pointing at a script that reads context_window.used_percentage from stdin - that field is (input_tokens + cache_creation_input_tokens + cache_read_input_tokens) / context_window_size, and it never counts output tokens. Context window size is 200,000 tokens by default, 1,000,000 on extended-context models. The bar tells you how full the window is. It does not tell you what filled it.why the default status line never shows you a context number
Out of the box, Claude Code's status line shows almost nothing - it's the row of keyboard hints (esc to interrupt, ? for shortcuts) sitting above the input box. There's no built-in context percentage anywhere in that row. You can always run /context for a one-off breakdown, but nothing persists on screen unless you configure a statusLine command yourself.
That's opt-in on purpose: a status line runs an arbitrary shell command on your machine every time the assistant responds, so Claude Code isn't going to wire one up without you asking. The moment you do configure one, the trade is explicit too - most of those footer keyboard hints disappear, because the row they lived in is now yours.
If you're here because a counter you used to see went missing entirely rather than never existing, a custom statusline is also the fix that survives that particular class of regression - it reads the same context_window fields directly instead of depending on whatever built-in display broke.
two ways to add one: /statusline or a script you control
The fastest route is the /statusline command itself. Describe what you want in plain language:
/statusline show model name and context percentage with a progress bar
Claude Code generates a script under ~/.claude/, wires the statusLine field into your settings automatically, and asks for file-edit permission along the way. For most people this is the whole job.
The manual route exists for when you want to control the exact formatting - colors, cache breakdown, a second line for git status - or you just want to see what /statusline did under the hood. That's what the rest of this guide builds.
| Method | Setup | Control | Best for |
| --- | --- | --- | --- |
| /statusline command | One line, no file editing | Claude Code picks the format | Getting a working bar in under a minute |
| Manual script + settings.json | Write the script, wire the config | Full control - colors, cache breakdown, multiple lines | Matching an existing dotfiles setup, or understanding the mechanism |
the exact config and script, tested against the real payload
Add a statusLine block to ~/.claude/settings.json:
{
  "statusLine": {
    "type": "command",
    "command": "~/.claude/statusline.sh"
  }
}
Save the script it points to. This version reads the three fields that matter for a context bar - percentage, and the cache reads/writes that back it up - and color-codes the bar the same way the official docs' own multi-line example does (green under 70%, yellow 70-89%, red 90%+):
#!/bin/bash
input=$(cat)

MODEL=$(echo "$input" | jq -r '.model.display_name')
PCT=$(echo "$input" | jq -r '.context_window.used_percentage // 0' | cut -d. -f1)
CACHE_READ=$(echo "$input" | jq -r '.context_window.current_usage.cache_read_input_tokens // 0')
CACHE_WRITE=$(echo "$input" | jq -r '.context_window.current_usage.cache_creation_input_tokens // 0')

GREEN='\033[32m'; YELLOW='\033[33m'; RED='\033[31m'; RESET='\033[0m'
if [ "$PCT" -ge 90 ]; then COLOR="$RED"
elif [ "$PCT" -ge 70 ]; then COLOR="$YELLOW"
else COLOR="$GREEN"; fi

BAR_WIDTH=10
FILLED=$((PCT * BAR_WIDTH / 100))
EMPTY=$((BAR_WIDTH - FILLED))
BAR=""
[ "$FILLED" -gt 0 ] && printf -v FILL "%${FILLED}s" && BAR="${FILL// /▓}"
[ "$EMPTY" -gt 0 ] && printf -v PAD "%${EMPTY}s" && BAR="${BAR}${PAD// /░}"

echo -e "[$MODEL] ${COLOR}${BAR}${RESET} ${PCT}% | cache read ${CACHE_READ} / write ${CACHE_WRITE}"
Make it executable - chmod +x ~/.claude/statusline.sh - and you're done. Before trusting any statusline script, the docs' own tip is to feed it mock JSON on the command line rather than waiting for a real session to hit the right percentage. I did exactly that, at three usage tiers, and this is the real output, unedited:
$ echo '{"model":{"display_name":"Sonnet 5"},"context_window":{"used_percentage":8,"current_usage":{"cache_read_input_tokens":2000,"cache_creation_input_tokens":5000}}}' | ./statusline.sh
[Sonnet 5] ░░░░░░░░░░ 8% | cache read 2000 / write 5000

$ echo '{"model":{"display_name":"Sonnet 5"},"context_window":{"used_percentage":76,"current_usage":{"cache_read_input_tokens":94000,"cache_creation_input_tokens":12000}}}' | ./statusline.sh
[Sonnet 5] ▓▓▓▓▓▓▓░░░ 76% | cache read 94000 / write 12000

$ echo '{"model":{"display_name":"Opus 5"},"context_window":{"used_percentage":93,"current_usage":{"cache_read_input_tokens":151000,"cache_creation_input_tokens":18000}}}' | ./statusline.sh
[Opus 5] ▓▓▓▓▓▓▓▓▓░ 93% | cache read 151000 / write 18000
Notice the 8% run: a fully empty bar. That's not a bug, it's integer math - BAR_WIDTH=10 means anything under 10% rounds down to zero filled blocks. Don't read an empty-looking bar as "no usage" without also glancing at the printed percentage next to it.
model.display_name→the [Sonnet 5] tagcontext_window.used_percentage→the printed % and the bar fill amountcontext_window.current_usage.cache_read_input_tokens→"cache read" in the breakdowncontext_window.current_usage.cache_creation_input_tokens→"cache write" in the breakdowncontext_window.context_window_size→200,000 by default, 1,000,000 on extended-context modelsEvery one of these is present on the JSON Claude Code already sends your script - nothing here needs a second data source.
what used_percentage actually counts (and what it leaves out)
context_window.used_percentage is pre-calculated by Claude Code, but it's worth knowing the formula it's running, because it explains a couple of things that otherwise look like bugs. It's input_tokens + cache_creation_input_tokens + cache_read_input_tokens, divided by context_window_size - which defaults to 200,000 tokens and rises to 1,000,000 on models with extended context. Output tokens from the current response are never part of that percentage.
Two fields worth knowing before you build around them:
context_window.current_usageisnullbefore the first API call in a session, and goesnullagain immediately after/compactuntil the next call repopulates it. A script that assumes it's always an object will crash on a brand-new session - the// 0fallbacks in the script above exist for exactly this.- The official docs note that
/context's own number can differ slightly from the statusline's, because the two are calculated at different moments. If you're cross-checking, expect them to agree in spirit, not to the token.
reading the number: color thresholds and the auto-compact tie-in
Where the red band actually triggers compaction depends on your model and any autoCompactWindow you've set - not a fixed 90% for every session.
The 70/90 split above isn't arbitrary - it's lifted straight from Claude Code's own example script for a color-coded bar. What it maps to underneath, though, depends on your setup. Compaction doesn't fire at a fixed "90%" for everyone: it fires based on the model's context window and whatever autoCompactWindow you've set, which you can change any time with /autocompact 500k (or /autocompact auto to reset to the model's tuned default). Sonnet 4.6 and Opus 4.6 without extended context compact at the 200K boundary; models running the 1,000,000-token window compact much later in absolute tokens, even though the bar still reads the same 0-100% either way.
So a red bar on a 200K-window session and a red bar on a 1M-window session mean the same thing relatively - you're close to a compaction pass - but a very different number of tokens away from it.
what the number can't tell you
- -one live percentage, refreshed on every assistant turn
- -updates per session - closes when the session does
- -no breakdown by CLAUDE.md, skills, MCP servers, or subagents
- -reads real session history across every project, not just the open one
- -breaks usage down by CLAUDE.md size, MCP server overhead, and subagent spend
- -flags what's safe to cut before you touch a config file
The percentage answers exactly one question: how full is the window right now. It doesn't say why. A 76% session could be one enormous file read, a CLAUDE.md file nobody's trimmed in months, a handful of MCP servers loading their instructions on every turn, or three subagents each carrying their own copy of your project's context. The statusline JSON has no field for any of that breakdown - it wasn't built to have one, it was built to be fast and cheap to compute on every assistant turn.
Figuring out which of your own settings is actually driving that number up over many sessions is a different job from watching one live percentage - it needs a look at your actual history, not just the current turn.
when this doesn't apply
A few cases where this setup won't help:
- Fresh or untrusted directories. The statusline command only runs once you've accepted the workspace trust dialog for that folder - a clone you haven't trusted yet just shows a blank row, script and all.
- Non-interactive or CI runs. The status line renders in the interactive terminal UI. It's not something a headless or scripted Claude Code invocation will show you.
- You already run a community statusline. Projects like
ccstatuslineandstarship-claudeship this exact context bar (and a lot more) pre-built - there's no reason to hand-roll it twice. - Your script is slow. Claude Code captures your script's output and blocks the row from updating until it returns; a script shelling out to something slow (an uncached
git statusin a huge repo, a network call) will make your bar visibly lag instead of feeling live.
FAQ
- Does the status line cost me tokens? No. It runs locally on your machine and never touches the API by itself.
- Why does my bar show completely empty under 10% usage? Integer division. A 10-block bar times a single-digit percentage rounds down to zero filled blocks - check the printed number, not just the bar, at low usage.
- Will this match what
/contextshows me? Close, but not guaranteed to the token - they're calculated at different points in the request cycle. - Can I get a similar bar for subagents? That's a separate setting,
subagentStatusLine, which renders one row per visible subagent with its owntokenCountandcontextWindowSizefields - worth its own script if you run several subagents at once. - My statusline shows nothing at all - what's wrong? Check three things in order: the script is executable (
chmod +x), it's writing to stdout and not stderr, and you've accepted the workspace trust prompt for the current directory.
None of this requires guessing at where your context actually goes session over session - the free scan reads your real Claude Code history and tells you what's driving the number this bar only reports, before you decide what's worth trimming. If the cause turns out to be your CLAUDE.md file specifically, reducing what Claude Code loads into context covers the rest of the levers, and the context window calculator is a quick way to see how close a given session is to the 1,000,000-token ceiling before you'd bother upgrading for it.
See your own numbers
These are aggregates from real sessions. Your setup is different - run the free scan and get the breakdown for your own Claude Code history. It runs locally; nothing about your code or prompts leaves your machine.
npx usagecutRun a free scan → Made by Neo
UsageCut by ClockedCode - not affiliated with Anthropic. The figures on this page are measured on real Claude Code sessions and labeled measured or estimated where it matters.